About Us
Please read the FAQ first to see if your question is there. This website was an EECS Senior Design / Capstone project at Ohio University during the 2018-2019 Fall/Spring semesters.
Student Team: Kevin Croissant Zac Arnett Jonathan Waters Hunter Fordyce
The Faculty Project Leader for this project is Dr. Michael Braasch. Affiliations:
Dr. Michael Braasch is a Professor in the Electrical Engineering and Computer Science Department at Ohio University, as well as a Principal Investigator at the OU Avionics Engineering Center.
The Student Team Members were all undergraduates in the EECS Department at Ohio University.
Zac, Jon, and Kevin also worked as Undergraduate Research Assistants at the OU Avionics Engineering Center while this project was in development.
More information about the Ohio University Avionics Engineering Center is available here. Project Background:
The project started with background research in multi-constellation receiver technologies and key ideas in order to accomplish the following objectives:
- Develop a system to simultaneously collect and plot position data from each GGGB (GPS, GLONASS, Galileo, BeiDou) constellation individually.
- Develop a website to display the positioning performance of the constellations.
- Write a user manual for future maintenance of the system. Please contact Dr. Braasch at the email above if you would like to replicate this project.
Frequently Asked Questions
It's a magic box where GNSS signals go in and plots come out. Just kidding.
Our goal for the website was to provide the navigation community a user-friendly way to view the positioning performance of the four major constellations: GPS, GLONASS, Galileo, and Beidou.
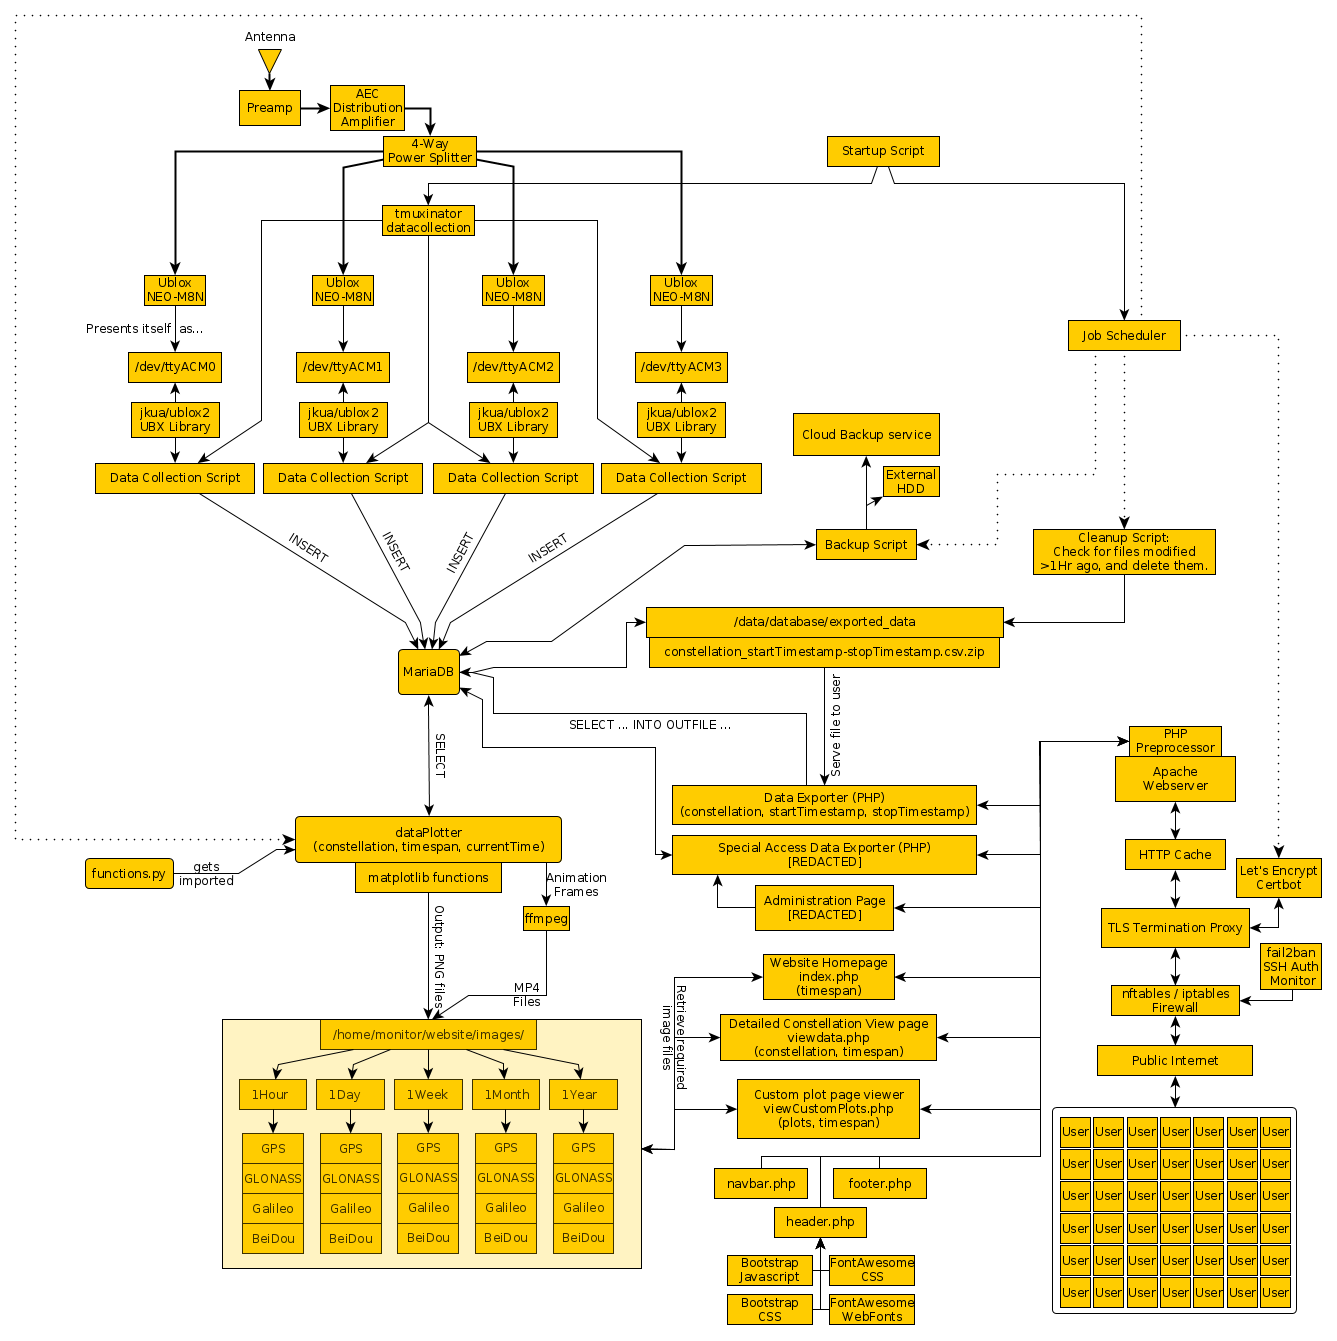
Here is a quick summary of how the system works:
- Hardware
- Antenna:
We are using a NovAtel GPS-704-X Triple-Band GNSS Antenna with a JCA12-4189T preamp. - Receivers:
We are using four U-Blox NEO-M8N GNSS receivers. They are connected to the antenna with LMR-400 coax, and a MiniCircuits ZA4PD-2+-S+ power splitter. - Server:
Our server has an AMD Ryzen 7 2700X CPU, 32GB of DDR4 RAM, two RAID1 SSDs for our database, and a 100Mb/s uplink to the internet. - Software
- Data Collection:
We interface with our U-Blox Receivers using the binary UBX protocol. - Data Storage:
Our data is stored in a MariaDB SQL database. The database is on a RAID1 of two 1TB SSDs. In addition to the RAID, the database is backed up regularly to an offsite location. - Data Plotting:
All plots are created using matplotlib and Python3. The 3D Rotating Scatterplots are created one frame at a time, and then made into a MP4 with ffmpeg. - Website:
We use a combination of fairly vanilla PHP and Apache to serve pages to users. In addition, Varnish is running to keep system load low and avoid disturbing the data collection. Let's Encrypt provides our HTTPS certificate.
The website design uses Bootstrap 4 for most of the layout and CSS.
Absolutely! The only condition is that you must adhere to the Creative Commons Attribution 4.0 International License. Don't worry, it's easy.
If you end up using the data somewhere, we would love to know! Please send us an email: admin@gnssperformancemonitor.com.
- Horizontal Error Scatter Plot:
- This scatter plot shows 2-dimensional horizontal error. The origin, (0,0) is located at the center of the map, which corresponds to the antenna’s surveyed location. Any deviation from the point (0,0) is due to a positioning error.
- Horizontal Error Heatmap:
- The heat map is a 2-dimensional histogram that shows 2-dimensional horizontal error. The origin, (0,0) is located at the center of the map, which corresponds to the antenna’s surveyed location. Any deviation from the point (0,0) is due to a positioning error. The heat maps additionally encode the frequency of the received position data into the color of each pixel, which can be decoded with the colorbar to the right.
- Line Plots (Horizontal, East, North, and Vertical):
- The line plots show the data in a line format with data points. The computed statistics are also overlaid for the user specified time period.
- Histograms (Horizontal, East, North, and Vertical):
- These histograms show the received data and how frequently the position error falls within a certain range from the origin.
- “DOPs” Line Plot:
- The line plots shows the dilution of precision (DOP) data that is collected in a line format with data points. This data describes the error caused by the relative position of the constellation satellites to the antenna’s location, in this case Athens, OH.
- PDOP = position dilution of precision
- HDOP = horizontal dilution of precision
- VDOP = vertical dilution of precision
- GDOP = geometric dilution of precision
- EDOP = east dilution of precision
- NDOP = north dilution of precision
- TDOP = timing dilution of precision
- More information
- “SVs used in solution” Line Plot:
- This plot shows the number of SVs, satellite vehicles, commonly referred to as satellites used to determine the position that is received by the receiver. In order to determine a position at least 4 SVs must be visible, and this can explain much of that data that appears to be missing from the incomplete constellations.
- 3-Dimensional Rotating Scatter Plot:
- This scatter plot shows 3-dimensional position error of the user-selected constellation. The origin, (0,0,0) is located at the center of the map, which corresponds to the antenna’s surveyed location. Any deviation from the point (0,0,0) is due to a positioning error.
As of March 2019, BeiDou and Galileo are still incomplete constellations, and are not yet fully operational in our area.
As a result, the SV geometry is sometimes very poor, which leads to a very bad position error from our receiver.
As more satellites are launched and are made operational by the operators of these constellations, their performance will improve.
We were allocated 28 weeks (two semesters) for the project. This schedule was driven by Capstone course requirements as shown below: